The product
One connected experience. Every way you analyze.
Chat, Query Lab, spreadsheet, and dashboards all stay perfectly in sync — so an answer you trust in chat is the same answer you pin to a dashboard.
Conversational analysis
Ask in plain English; get a chart-first answer with the key number and a clear explanation — never a black box.
Understands your data
TalkLytx automatically learns your terms, metrics, and how things relate — accurate from the start, with zero setup.
Answer engine you can trust
TalkLytx plans, double-checks, and verifies every answer — and does the math itself, so the numbers are always reliable.
Live dashboards
Pin living views, not frozen snapshots. Filter, drill in, and ask follow-ups on any card — each refresh uses your latest data.
Query Lab & spreadsheet
Explore all your data sets together with AI assist, plus a smart grid to filter, clean, group, and enrich your data.
Privacy & control
Everything runs in your browser, with permissions and a full activity history. The AI always respects each person's access.
Chat that earns trust
A chat-first workspace, designed to show its work
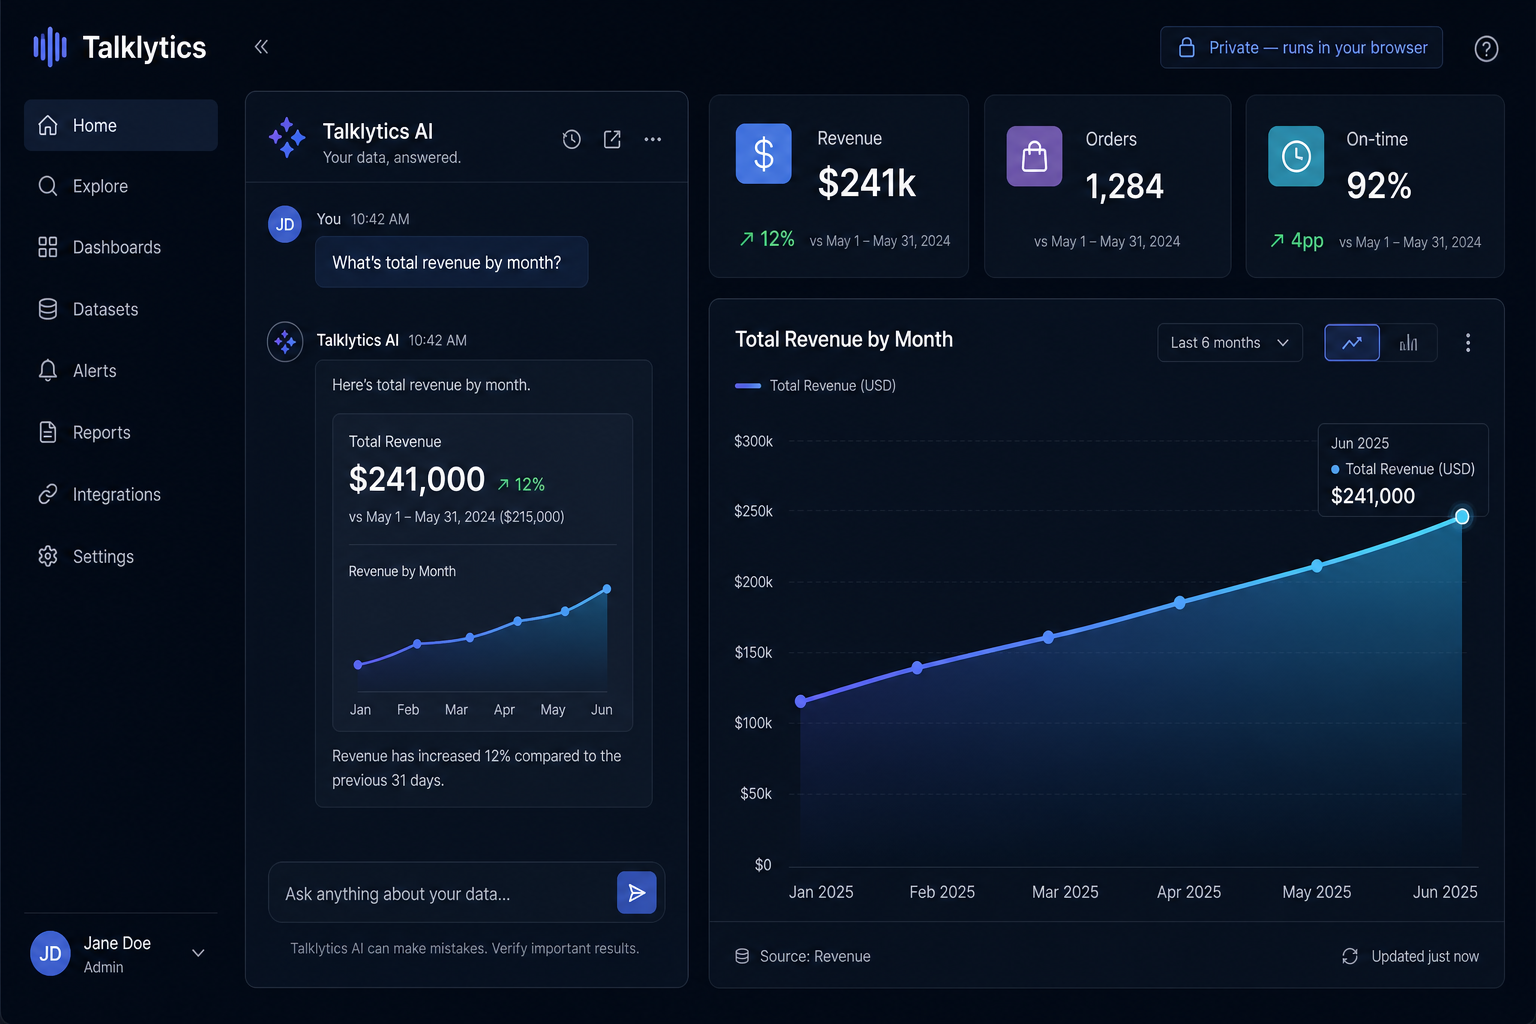
Every answer leads with the picture — a chart or a key number — then offers the underlying data and a step-by-step view of how it was reached. Answers stream in live: the explanation appears first, then the chart fills in. No blank spinners, no promises the product can't keep.
- Chart-first answers you can dig into
- Smart follow-up suggestions for your data
- Bring multiple data sets together in chat
See behind every answer
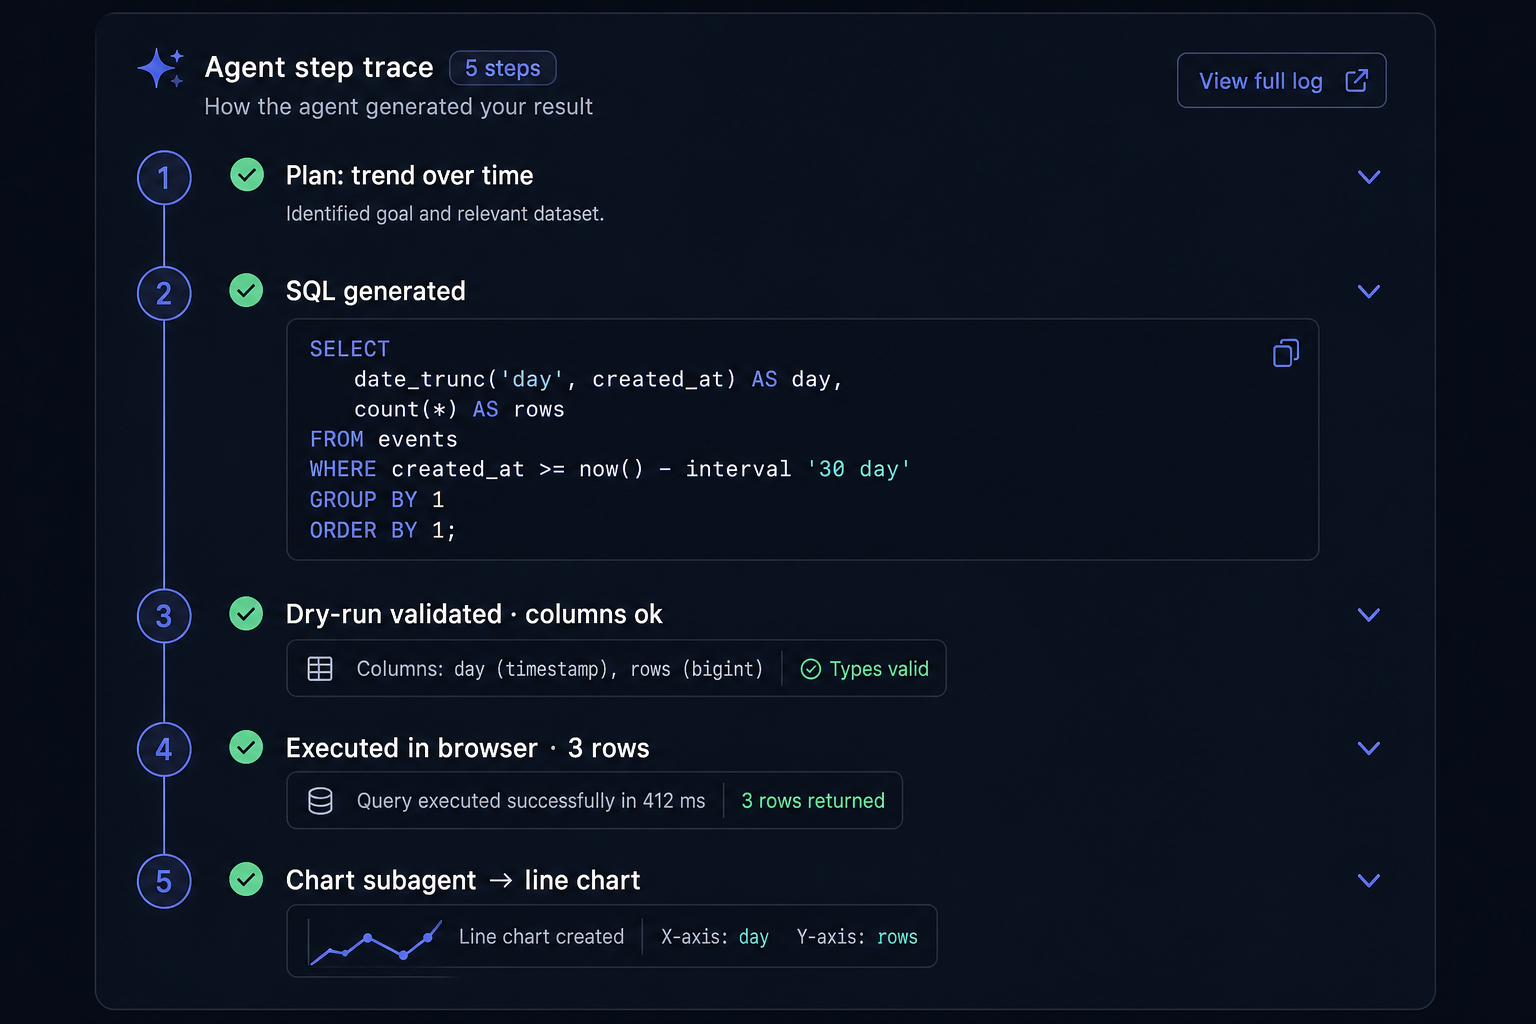
An answer engine you can check, step by step
TalkLytx works out what you're asking, builds the answer using its understanding of your data, double-checks it before running, calculates the result right in your browser, and only then picks the chart. Each step is laid out so you can expand it and see exactly what happened.
- Accuracy checks before any result
- Smart self-correction when something's off
- Clear sourcing for every number
Decisions, not just charts
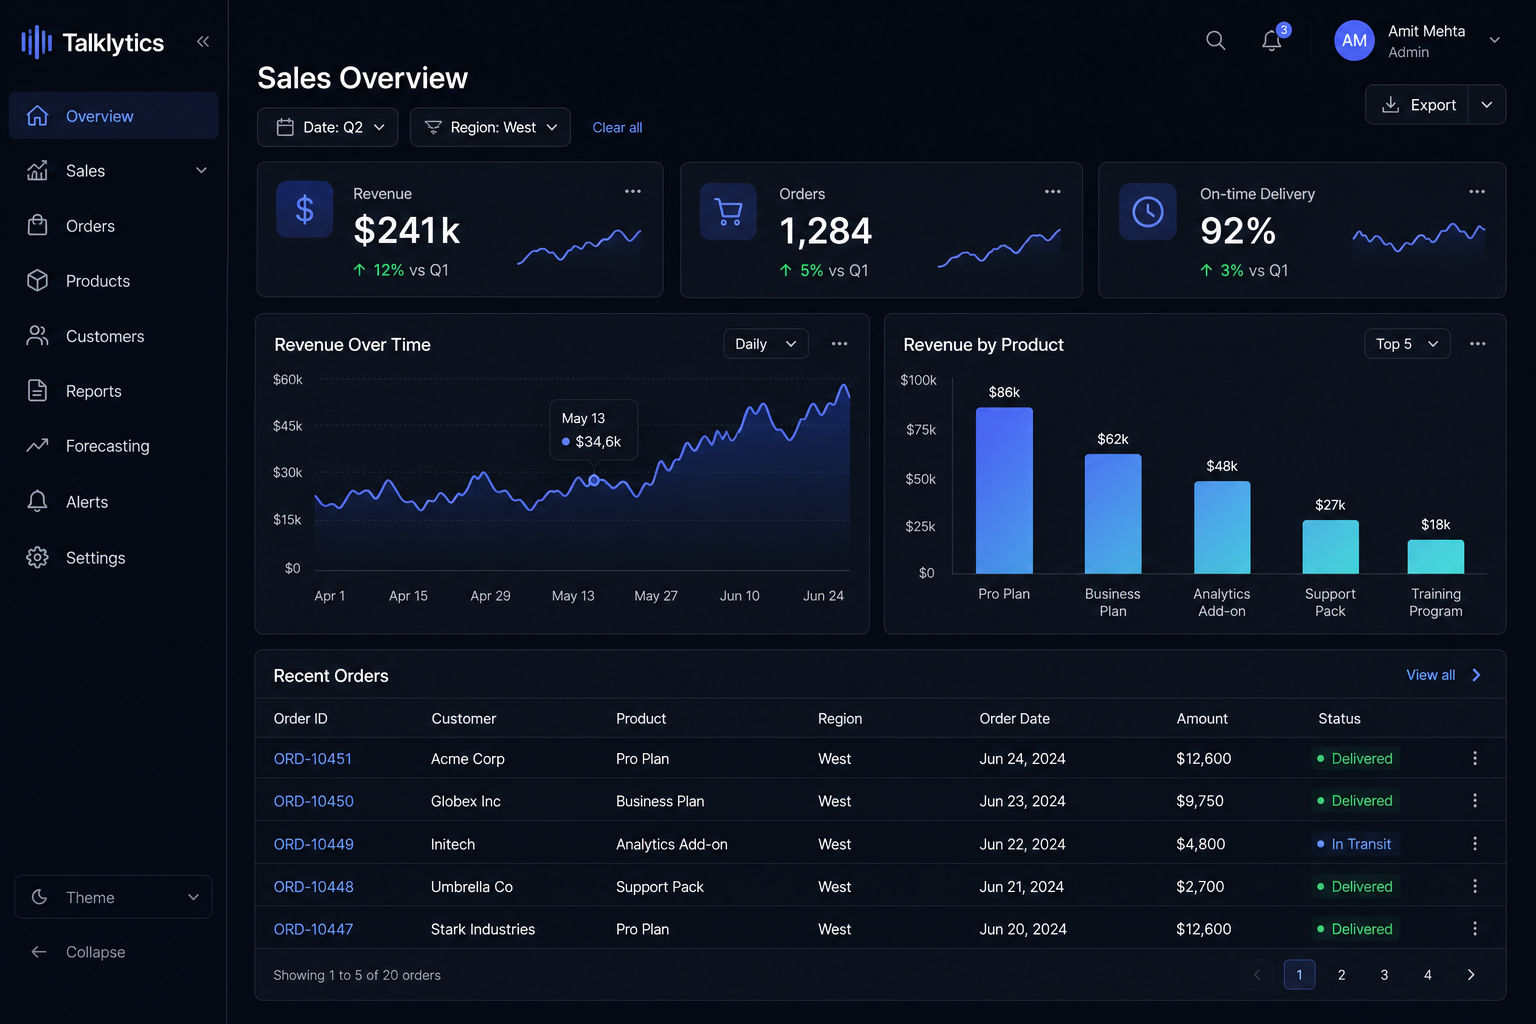
Dashboards that stay live and interactive
Pin any result to a dashboard that always knows how to refresh itself. Key numbers show your pace to goal, clicking a chart filters every card, and clicking a value reveals the underlying records right there — no navigating away. Export a self-contained, interactive report in a single click.
- Pace-to-goal at a glance
- Click to filter and drill in
- Interactive report, spreadsheet & data export
Capabilities
Built for the way analysts actually work
See it on your own data
No setup, no complex tools, no card. Drop a file and ask your first question in seconds.